──── BLOG |
Scientific infographic examples for research and pharma
A scientific infographic has one job: carry the science on its own, with no narrator and no caption to rescue it. It goes on a poster, in a slide, in a paper, on a packaging insert — places where nobody is there to explain it.
Below are examples from our own work, what each one had to solve, and the rules that separate a figure a journal will print from an illustration that merely looks scientific.
A single frame that has to replace a paragraph
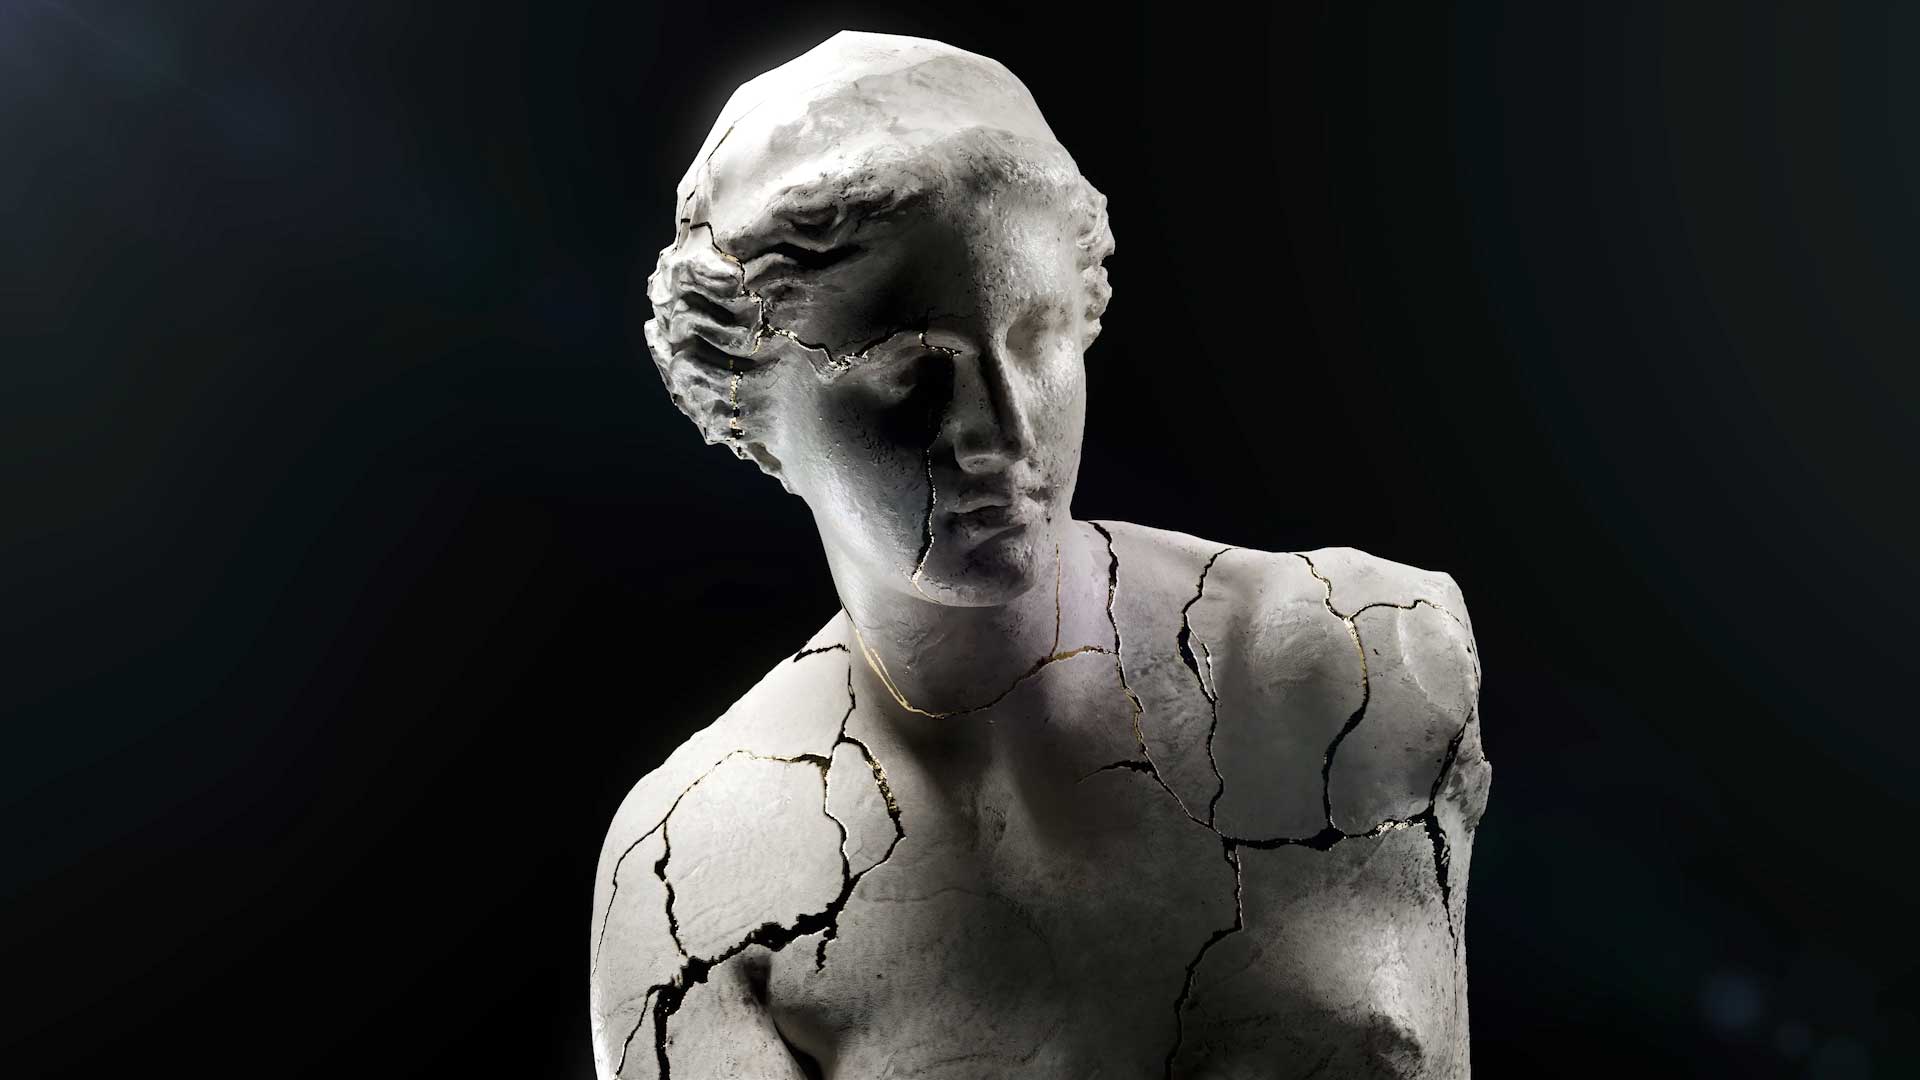
The 3D medical illustration we created for Dr. Stefan Danila TED talk is the clearest case in our portfolio: one image, an auditorium, no second chance. Everything the audience needed to understand had to be legible from the back row in the seconds it was on screen.
That constraint is a good test for any scientific figure. If it needs a build, a pointer or a sentence of setup, it is a slide, not an infographic.

Showing something nobody has photographed
For Germaine de Capuccini we produced a hyperrealistic visualization of the biomimetic exosome behind the Tecxosome Expert Lab range. There is no photograph of that structure at that scale, which is the normal situation in biotech communication.
When the subject cannot be photographed, every visual decision becomes a scientific claim: size, shape, surface, what is in the background. That is why the modelling brief and the scientific brief have to be the same document.
Equipment that has to be read, not admired
The renders of the Bionet F1 bioreactor exist so that someone can understand how a fermentation process runs through a machine. The aesthetic job is secondary to the reading order: inlet, process, outlet, in that sequence, without the eye getting lost in the housing.
Industrial and laboratory equipment is where infographics most often fail, because the temptation is to render the product beautifully instead of explaining it.


A mechanism of action as a still image
Our Salvat UVESOL work exists as a mechanism of action animation, and a still frame from that same 3D build does a different job: it goes on the poster, in the leave-behind and in the congress abstract, where there is no time to play a video.
This is the most economical thing a pharma team can do with an existing animation, and the most frequently forgotten. The assets are already paid for. See MOA animation for pharma.
The four rules that decide whether it works
Accuracy before style. An illustration that looks good and is wrong is worse than none. Proportion, scale and the relationship between structures come first.
One idea per image. Two ideas means two figures.
A reading order. The eye has somewhere to start and somewhere to end, and the layout decides it rather than hoping.
Legible at final size. A figure designed on a large screen and printed at ten centimetres is a different figure. Check it at the size it will actually be seen.


Where the images come from
Every example above is a still from the same 3D work that produces the animations: the anatomy, the molecule or the device is modelled once and then photographed from whatever angle the figure needs. Our Corsa digital twin and 3D product configurator is the extreme version of that idea — one model, an unlimited number of correct images.
Planned this way, illustration stops being a separate line in the budget and becomes an output of work already commissioned.
MORE GUIDES

VR for Pain Management: How It Is Used and What It Takes to Build
What Is VR Therapy? Uses, Limits and How One Is Built
3D Body and Face Scanning for Medical Projects: When It Is Worth It
Digital Human and Avatar Technology: How One Is Actually Built
What Is a Digital Human? Uses in Healthcare and Pharma
Virtual Reality in Psychology: What Is Used and What It Takes to Build
What Is a Virtual Patient? Uses in Medical Training

Augmented Reality in Surgery: Use Cases Today

VR Surgical Training: How It Works and What It Costs

Virtual Reality in Surgery: Training, Planning and the Future
Contact
Contact Us
Contact
Contact Us
Boston, Massachusetts, USA
T: (+1) 617 351 8477
M: (+1) 484 473 1704
info@pixel-medical-animation.com
Business Hours:
Mon-Fri: 9am-6pm (local time)
How can we help you?

SERVICES
- Medical 3D Animation in Boston
- Medical 3D Animation in Miami
- Medical 3D Animation in Los Angeles
- Medical 3D Animation in Minneapolis
- Medical 3D Animation in New York
- Medical 3D Animation in Raleigh Durham
- Medical 3D Animation in Chicago
- Medical 3D Animation in Texas
- Medical 3D Animation in Seattle
- Medical 3D Animation in Washington DC